To be a successful trader, you must understand how to handle charts in MetaTrader 4. In order to get the most out of your trading experience, you must first understand what they are. By using price charts, you may have access to a wide amount of information. To design their trading strategy, it is up to the traders to pick what information and data they will employ. Additionally, you may open a free trial trading account and obtain exposure to over 200 different financial products using virtual dollars.
Managing Charts in Metatrader 4: An Introduction
Due to the large amount of market data accessible, it is essential to be able to understand it effectively. Charts that are well-designed and easy to read in MetaTrader 4 will assist the trader in reacting more quickly to any potential market possibilities.
This step-by-step MetaTrader 4 lesson will assist you in the following areas:
- Create and organise new charts;
- alter the types and periods of existing charts;
- scaling and shifting of charts;
- adding and removing indicators.
- Customize the trade charts to your liking;
- Use chart layouts and profiles to your advantage.
- Using data from charts.
What is the best way to create a new chart?

- If you don’t have any charts open in MetaTrader 4 when you first start the program, go to “File” and select “New Chart.”
- There will be a new menu with a list of the most popular currency pairs, as well as the remaining instruments. Choose the one that you require.
- You have the option of making the chart larger or keeping it in a smaller window.
Arrange charts.
Charts may be closed and managed in the same way that conventional windows are. Just remember to keep the chart highlighted while you’re doing the task at hand by clicking on it once more.
You may open numerous charts at the same time and flip between them using the tabs below the chart, or you can arrange them as tiles on the screen. It is possible to do so by clicking on the “Tile” button in the toolbar above the chart or by right-clicking on the chart tabs, which will allow you to quickly transition between the different perspectives.
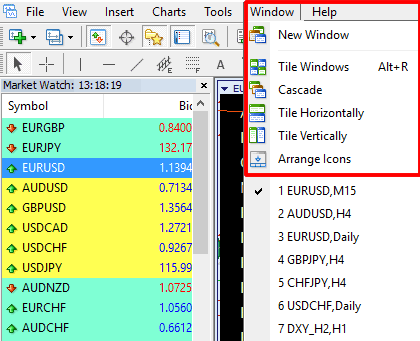
What is the best way to shift and change MT4 charts?
Alternatively, if the price is clinging to the right-hand side of the chart, you may use the “Shift” button to move the chart’s end further away from the border. With the little grey icon at the top of the table, you can modify the distance between the table and the border.
Right in front of the “Shift” button is a “Scroll” button, which automatically scrolls the chart to the most recent bars, ensuring that they are constantly visible on the screen.
Check that all Charts buttons are displayed in the toolbar by selecting “Toolbars” from the “View” menu and selecting “Charts” from the drop-down menu that appears.
Any adjustments to the chart may be made by selecting them from the context menu by right-clicking on them. You may change the chart’s appearance by removing or adding a grid or volumes. You may also pan around and zoom in and out from that point.
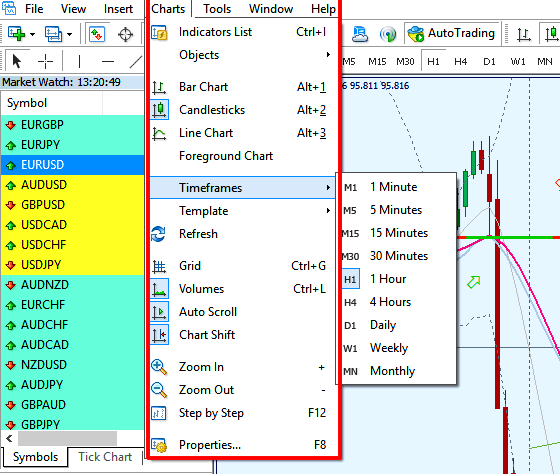
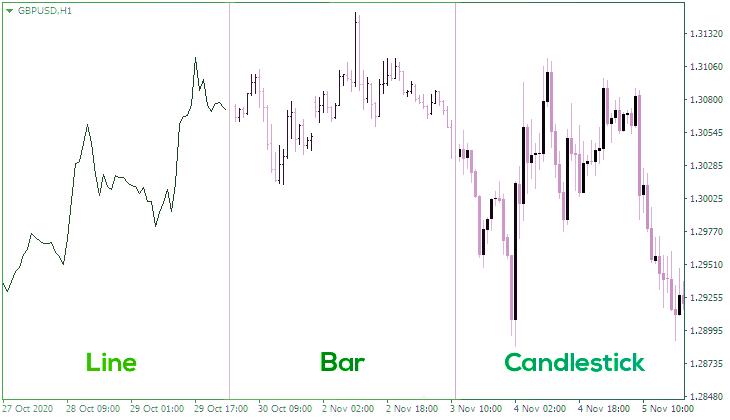
Chart types in MetaTrader 4.
Along with zooming in and out, you can also change how the data is shown by using the buttons on the Chart toolbar: The candlestick chart is a type of line chart.
Additionally, by specifying the limits of charts, it is possible to zoom in with extreme precision. Context chart properties may be accessed using the “Properties” window found in the context chart menu.
Scale options for MT4 charts.
Scale repair and scale fix One to One are two options that you can choose from. To save your work, click “OK.”
You may scroll left and right through the chart using the cursor keys on your keyboard, the mouse scroll wheel, or by dragging the chart with your mouse. Charts may also be adjusted step by step with F12 (scrolls by one bar to the left) and Shift+F12 (scrolls by two bars to the right) (scrolls by one bar to the right).
If the chart’s scale is fixed, it can be scrolled vertically as well as horizontally.
Add navigators to MT4 charts.
- The “Insert” main menu item, the “Navigator” menu item, the “Indicators list” button on the toolbar, or the “Indicators list” button on the main menu can all be used to add indicators.
- To remove an indication from the chart, just right-click on the indicator and pick “Delete Indicator” from the pop-up menu that appears.
- If you have a large number of indicators on your chart, you may right-click on the chart and pick “Indicators list” from the drop-down list. A window will emerge, allowing you to choose as many indications as you need from all of the ones that are now active and erase them all at once.
What is the best way to use chart templates and profiles?
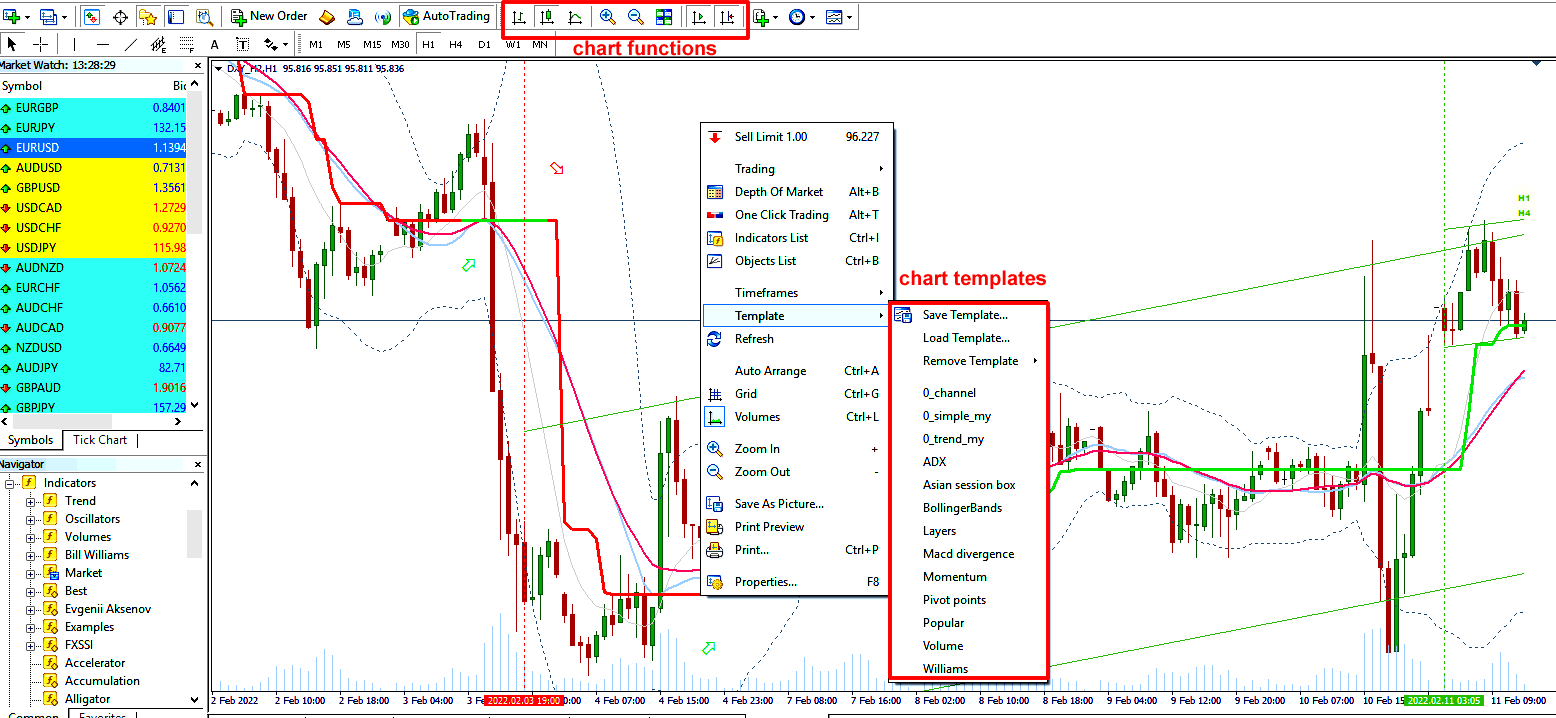
- From the toolbar, you can also load, save, and remove chart templates, among other things.
- Change the timeframe of the chart by using the toolbar or the “Periods” button.
- The Profiles option works in a similar way to the Templates option in that it allows you to store and load whole chart groups and their parameters. A user’s profiles may be managed from the “File” menu or by clicking on the “Profiles” button in the toolbar on the left.
- You may also employ graphical items to aid in your chart analysis, which can be inserted using the “Insert” menu or the Line Studies toolbar, respectively.
How to customize MT4 charts?
To modify a chart, choose it from the context menu and then select “Properties.” From there, you may alter the colours of the various elements inside the chart.
Export chart data.
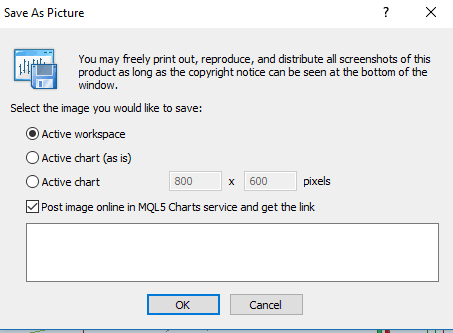
You can save the history data of active charts with the “Save as” or “Save as picture” commands from the “File” menu or by right-clicking on the chart. Charts may be saved in a number of different formats, including CSV, PRN, HTM, BMP, and GIF. You may print your charts from the same menu that you created them.
If there are any inaccuracies in the chart data, it should be updated on a regular basis. Simply right-click on the chart and pick “Refresh” from the drop-down menu that appears.
